What Is a TEG?
The thromboelastogram (TEG) is a point-of-care viscoelastic test that measures the mechanical properties of a whole-blood clot as it forms and lyses over time. Unlike standard coagulation tests (PT/INR, aPTT, platelet count), which assess isolated steps of the coagulation cascade in plasma, TEG evaluates the complete hemostatic process — including coagulation factor activity, fibrin polymerization, platelet-fibrin interaction, clot strength, and fibrinolytic activity.
In interventional radiology, TEG is most useful for patients with cirrhosis, where standard INR is a poor predictor of bleeding risk due to the simultaneous reduction of both pro- and anticoagulant factors. TEG reveals the true hemostatic balance and identifies specific defects that can be targeted with blood products before high-risk procedures.
TEG Tracing — Components
Parameters and Normal Values
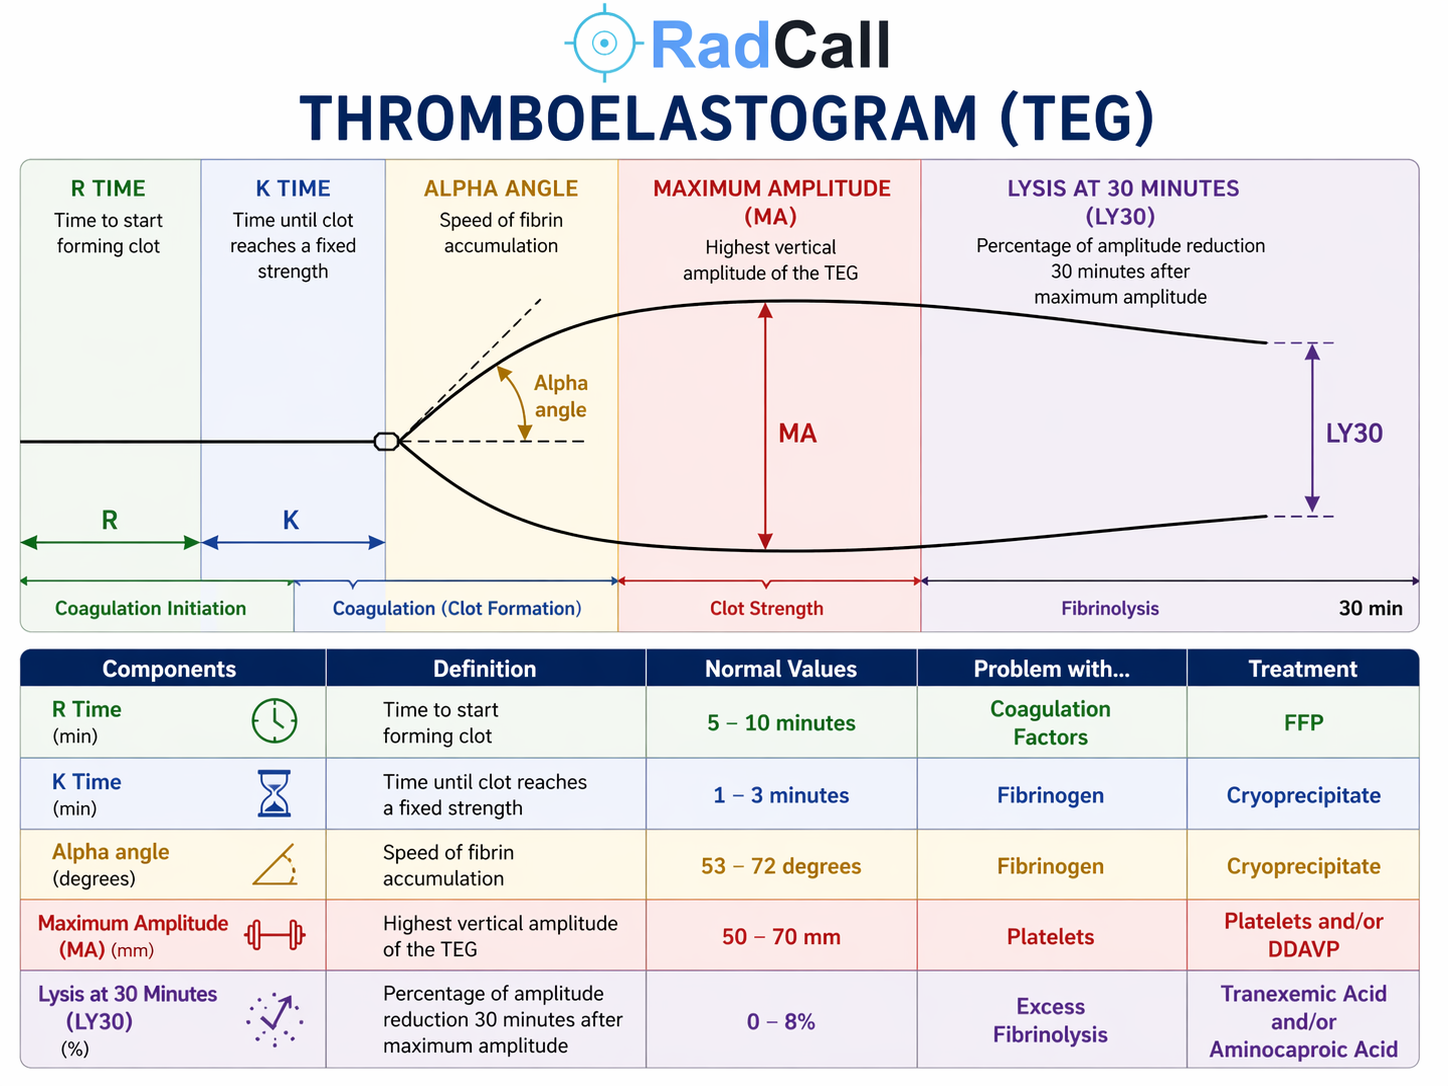
| Parameter | What It Measures | Normal Value | Abnormal → Problem | Treatment |
|---|---|---|---|---|
| R Time (min) | Time from sample placement to first detectable clot formation (clot amplitude 2 mm) — reflects speed of enzymatic coagulation; equivalent to PT/aPTT on a kinetic scale | 5–10 min | Prolonged R → Coagulation factor deficiency | FFP |
| K Time (min) | Time from clot initiation to amplitude of 20 mm — measures speed of fibrin accumulation and cross-linking once clot has begun forming | 1–3 min | Prolonged K → Fibrinogen deficiency | Cryoprecipitate |
| Alpha Angle (°) | Angle of the tangent to the TEG curve at the clot initiation point — reflects the rate of fibrin accumulation and cross-linking; parallel measurement to K time | 53–72° | Decreased alpha → Fibrinogen deficiency | Cryoprecipitate |
| Maximum Amplitude (MA) (mm) | Highest vertical amplitude of the TEG tracing — represents maximum clot strength; reflects primarily platelet-fibrin interaction (platelets ~80%, fibrin ~20%) | 50–70 mm | Low MA → Platelet deficiency or dysfunction | Platelets and/or DDAVP |
| LY30 (%) | Percentage reduction in clot amplitude 30 minutes after MA — measures fibrinolytic activity; how much clot has dissolved by 30 minutes | 0–8% | Elevated LY30 → Hyperfibrinolysis | Tranexamic acid or aminocaproic acid |
Phases of the TEG Tracing
| Phase | TEG Segment | Reflects |
|---|---|---|
| Coagulation Initiation | Flat line → R time | Thrombin generation; enzymatic coagulation cascade (factors II, V, VII, X) |
| Coagulation (Clot Formation) | R time → K time / alpha angle | Fibrin polymerization; speed of fibrin accumulation and cross-linking |
| Clot Strength | Peak amplitude → MA | Platelet-fibrin interaction; maximum clot mechanical strength |
| Fibrinolysis | MA → LY30 (30 min post-MA) | Plasmin-mediated clot dissolution; fibrinolytic activity |
Clinical Interpretation by Pattern
| TEG Pattern | Interpretation | Targeted Intervention |
|---|---|---|
| Prolonged R time only | Isolated factor deficiency — warfarin effect, factor deficiency, early heparin effect | FFP (10–15 mL/kg); vitamin K if warfarin-related; heparin reversal if indicated |
| Prolonged K time + decreased alpha | Fibrinogen/fibrin deficiency — often seen in cirrhosis, massive transfusion, DIC | Cryoprecipitate (10 units raises fibrinogen ~50–100 mg/dL); fibrinogen concentrate if available |
| Low MA | Thrombocytopenia or platelet dysfunction — check platelet count; consider aspirin, uremia, GPIIb/IIIa inhibitors | Platelet transfusion (target >50,000 for most IR procedures); DDAVP 0.3 mcg/kg IV for platelet dysfunction |
| Elevated LY30 (>8%) | Primary or secondary hyperfibrinolysis — seen in trauma, liver disease, post-thrombolysis, DIC with fibrinolysis | Tranexamic acid 1 g IV over 10 min; or aminocaproic acid 5 g IV load then 1 g/hr |
| All parameters normal | Hemostasis is functionally intact — in cirrhotic patients, this is highly reassuring and suggests elevated INR reflects balanced coagulopathy, not a true bleeding tendency | No blood product correction required; proceed with procedure |
| Narrow tracing (hypercoagulable) | Hypercoagulable state — shortened R time, elevated MA; seen in malignancy, early DIC, heparin-induced thrombocytopenia | Anticoagulation as clinically appropriate; avoid additional procoagulant agents |
TEG in the IR Setting
Cirrhotic Patients
Standard INR overestimates bleeding risk in cirrhosis because thrombomodulin-dependent protein C activation — a major anticoagulant pathway — is not captured by the PT assay. Patients with elevated INR due to cirrhosis may have a normal or even hypercoagulable TEG, reflecting the simultaneous reduction in both pro- and anticoagulant factors that produces a rebalanced — but fragile — hemostatic state.
For high-risk procedures (SIR Category 3) in cirrhotic patients, TEG provides a more accurate picture of true hemostatic capacity than INR alone. A normal TEG in a cirrhotic patient with INR 2.0–2.5 does not necessarily require FFP correction before proceeding. Conversely, an abnormal TEG pattern identifies the specific defect and guides targeted product administration.
Relevant Procedures
- CT-Guided Liver Biopsy — TEG is the preferred hemostatic assessment tool in cirrhotic patients; consider transjugular liver biopsy (TJLB) if INR >2.0 or significant ascites regardless of TEG
- TIPS — baseline hemostatic assessment in patients with advanced liver disease; TEG may guide product administration before the procedure
- PTBD — SIR Category 3; TEG in cirrhotic patients with elevated INR
TEG vs. ROTEM
TEG (Haemonetics) and ROTEM (Instrumentation Laboratory) are both rotational viscoelastic tests that measure similar hemostatic parameters. The parameter names and reference ranges differ between platforms — ROTEM uses different nomenclature (CT instead of R time, CFT instead of K time, MCF instead of MA). The underlying physiology and clinical interpretation are equivalent. Consult your institution's specific reference ranges when using ROTEM.
References
- Mallett SV, Cox DJ. Thrombelastography. Br J Anaesth. 1992;69(3):307–313.
- Tripodi A, Mannucci PM. The coagulopathy of chronic liver disease. N Engl J Med. 2011;365(2):147–156.
- Hartmann J, et al. Viscoelastic hemostatic assays: moving from the laboratory to the site of care. Transfusion. 2018;58(8):1815–1827.
- SIR Standards of Practice Committee. Consensus Guidelines for Periprocedural Management of Coagulation Status and Hemostasis Risk in Percutaneous Image-Guided Interventions. J Vasc Interv Radiol. 2012.